General education parity between members of minority communities and titular groups is assessed through the standardized test scores for the Programme for International Student Assessment (PISA). Every three years, PISA tests assess 15-year-old students' knowledge and skills in science, mathematics, and reading in the language of instruction in their schools. Students can take the test in the dominant or minority languages. We define the ethnic gap in educational attainment based on a point-difference score in the PISA test results across categories in each country between 2006 and 2018.
Majority-minority disparities in PISA assessment results
We calculate a point-difference score in the PISA test as a subtraction of the majority students' scores from those of minority students by the language of the test. If there was no ethnic gap in student achievements, we would observe a zero-point difference. A positive score indicates a gap in favor of the minority group, and a negative one indicates a gap in favor of the majority group.
Figure 1 visualizes the point-difference score in each of our cases. The continuous black line represents the point-difference score between minority and majority students tested in their mother tongues. The dashed line visualizes the same difference for minorities tested in the majority language. In most cases, the point-difference score is negative indicating that majority students consistently outperform their minority peers across test categories.
Table 1 summarizes the results of the average point-difference scores between majorities and minorities by the language of the test across all test years.
Figure 1: Average point-differences in PISA results of minority students compared to majority students
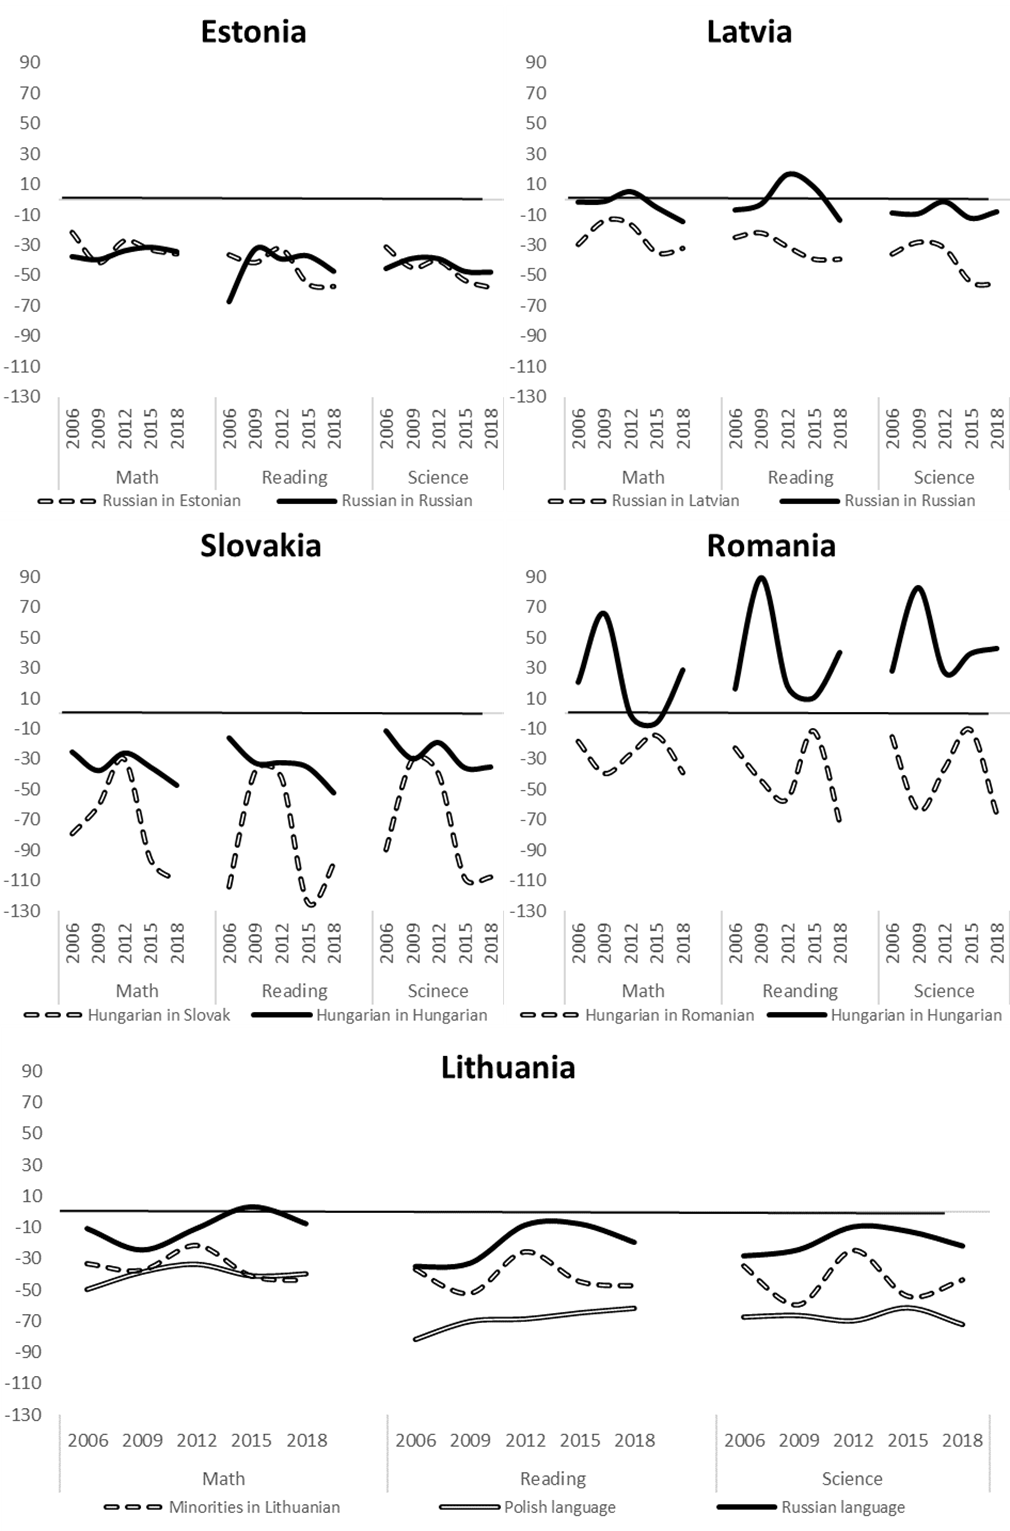
Table 1: Average point-difference scores between majority and minority students
| Country | Group | Mathematics | Reading | Science |
|---|---|---|---|---|
| Latvia | Russian speakers in Latvian | -25 | -31 | -41 |
| Russian speakers in Russian | -4 | 0 | -8 | |
| Estonia | Russian speakers in Estonian | -32 | -44 | -45 |
| Russian speakers in Russian | -35 | -45 | -44 | |
| Slovakia | Hungarians in Slovak | -75 | -83 | -67 |
| Hungarians in Hungarian | -34 | -34 | -24 | |
| Romania | Hungarians in Romanian | -28 | -41 | -39 |
| Hungarians in Hungarian | 22 | 35 | 44 | |
| Lithuania | Poles | -41 | -69 | -68 |
| Russian speakers | -10 | -21 | -19 |