We collected a time series on minority educational attainment at the tertiary level to assess the changes minority members have experienced over the past 30 years. The data is drawn from the early 1990s, early 2000s and 2011 census data.
Proportion of university graduates measure
Figure 2 presents the proportion of those with tertiary education among minorities and majorities in CEE between 1990 and 2011. The existence of persistent ethnic gaps in educational attainment suggests that access to higher education is unequal and structural disadvantages perpetuate over time.
Table 2 summarizes the data visualized in this Figure.
Figure 2: The proportion of university graduates according to census data
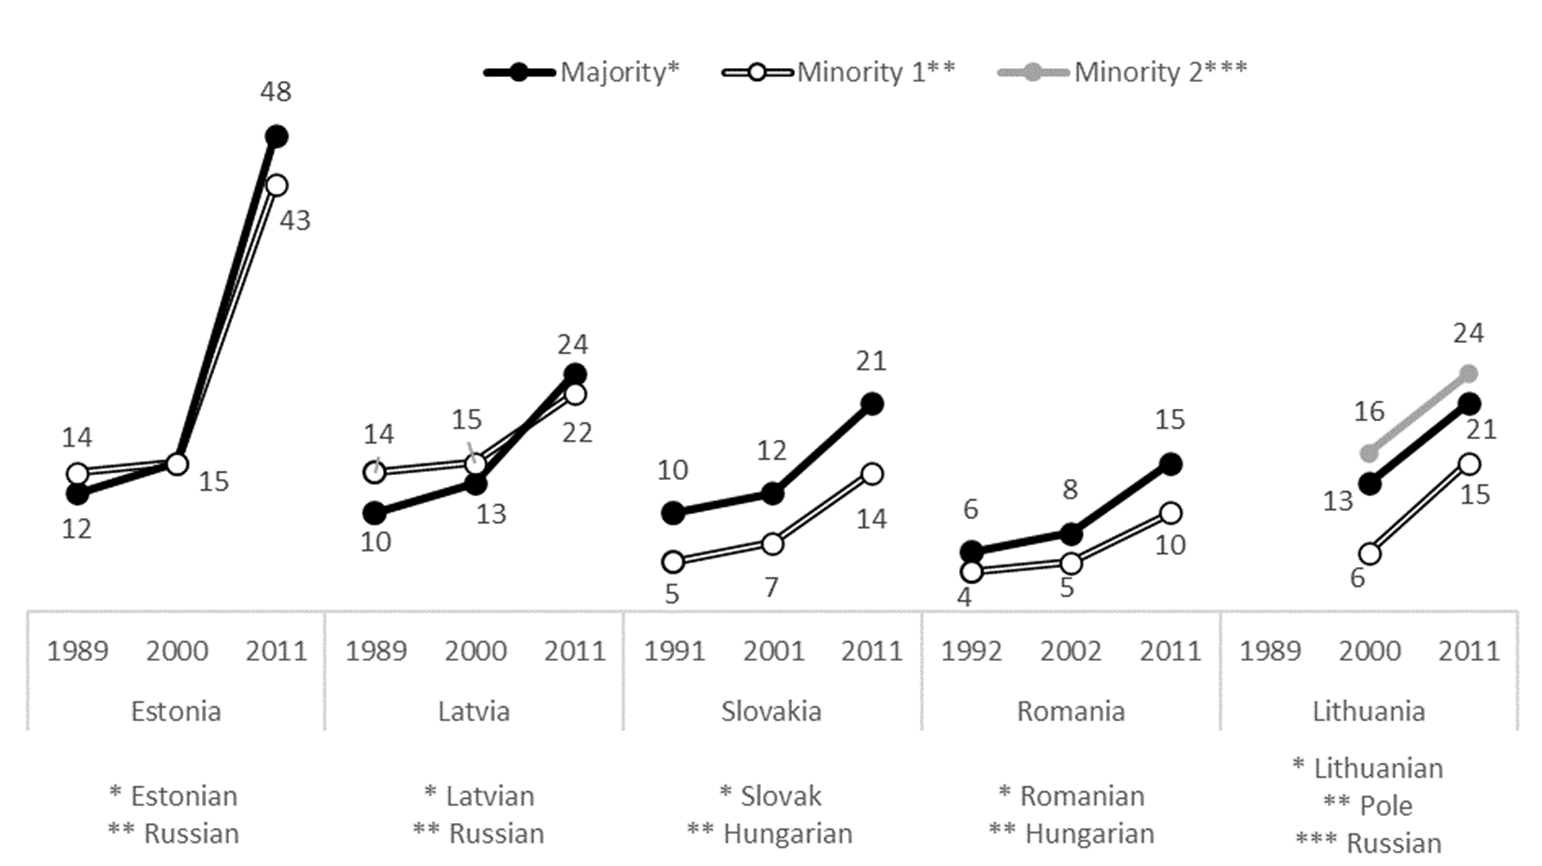
Table 2: Proportion of university graduates by ethnicity over time, according to census data
| Minorities | 1990s | 2000s | 2010s | |
|---|---|---|---|---|
| Romania | Romanians | 5.8% | 7.6% | 15.4% |
| Hungarians | 3.8% | 4.70% | 10.4% | |
| Slovakia | Slovaks | 9.9% | 12.4% | 21.2% |
| Hungarians | 4.5% | 6.9% | 13.6% | |
| Estonia | Estonians | 12% | 15% | 48% |
| Russians | 14% | 15% | 43% | |
| Latvia | Latvians | 10% | 13% | 24% |
| Russians | 14% | 15% | 22% | |